Oyu Tolgoi Copper Exports Resume After Protest Disruption in Mongolia
Copper concentrate deliveries from Mongolia's Oyu Tolgoi mine returned to normal after protesters briefly blocked a key export route to China.
Copper concentrate deliveries from Mongolia's Oyu Tolgoi mine returned to normal after protesters briefly blocked a key export route to China.

The Iran ceasefire is being read as good news for Gulf aluminium producers. The spread data tells a different story.
Protesters blocked a transport route serving Rio Tinto's Oyu Tolgoi mine in Mongolia, disrupting copper concentrate exports and prompting warnings of economic losses.
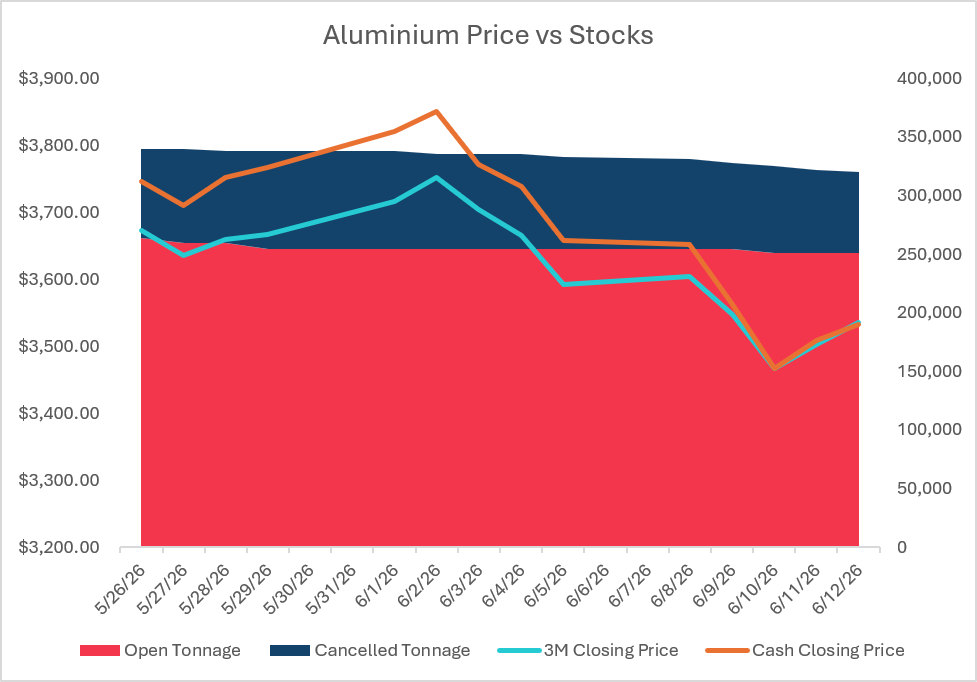
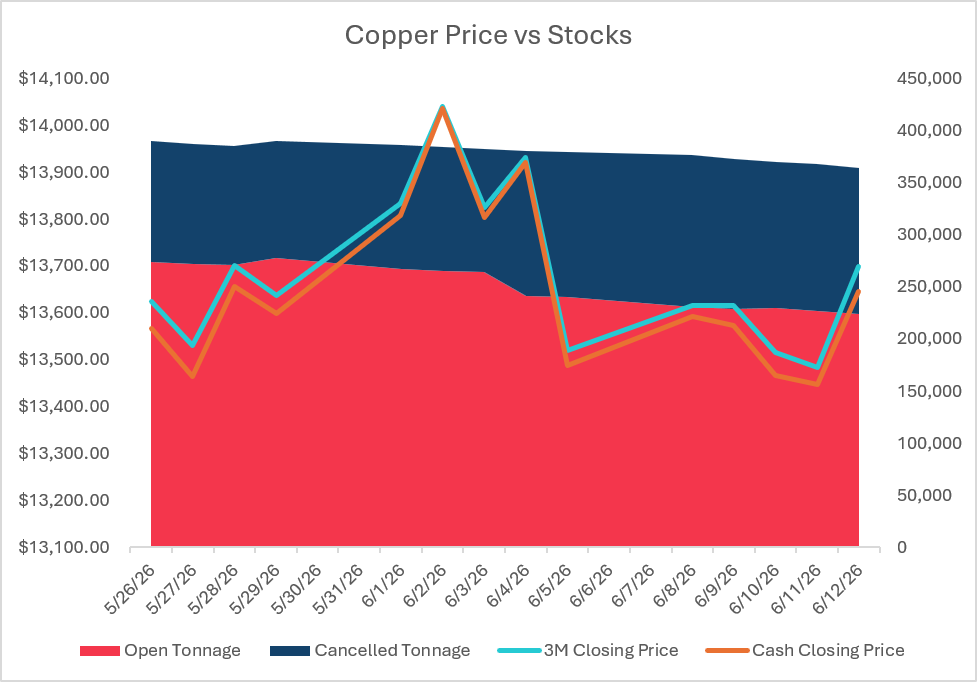
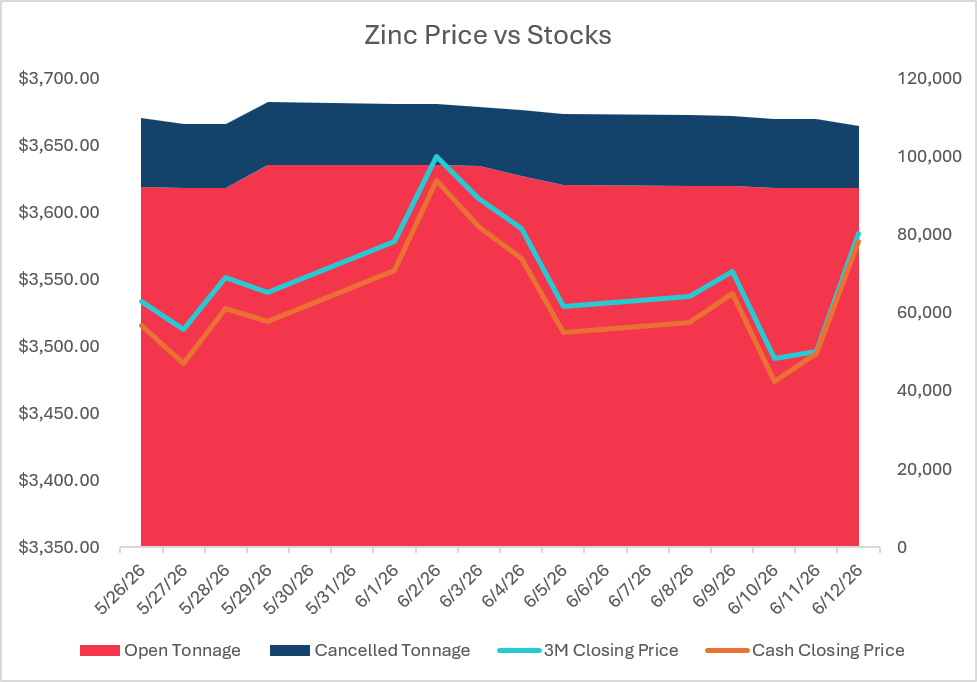
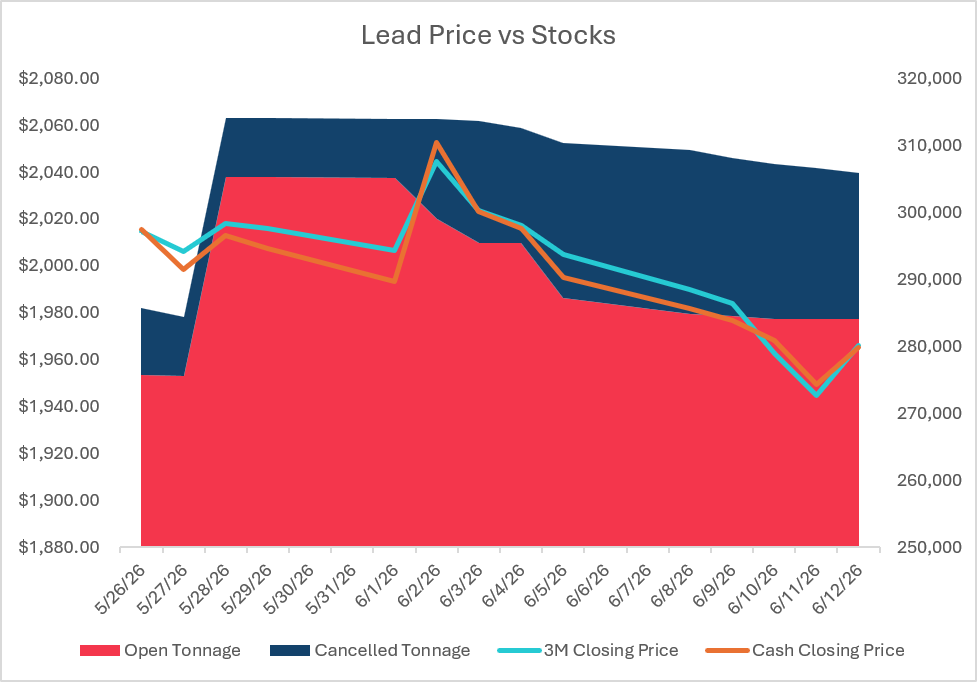
There was a split tone on LME base metals this week with copper, zinc, and tin finishing higher week-on-week, while aluminium, lead, and nickel all closed lower.

There was a split tone on LME base metals this week with copper, zinc, and tin finishing higher week-on-week, while aluminium, lead, and nickel all closed lower. Copper was the standout mover from a relative perspective, recovering from the prior Friday selloff to finish at a weekly high of $13,698/mt, with visible LME stocks falling another 15,125mt. Nickel was the weakest in the group, down $750/mt week-on-week and closing below $18,000/mt.
The macro remains difficult to separate from the physical picture. Firm US data and a stronger dollar continued to weigh on risk appetite, but the structural copper story (along with the current tariff potential) remains. Mine disruption risk, power grid demand, data-center buildout, electrification, and inelastic supply are all bullish to long-term copper prices. This week’s report therefore keeps the usual updates figures and charts for each metal, but replaces individual commentary with a spotlight on copper: why it matters, where it is used, who produces it, and why the market is so focused on the risk of future supply deficits.
Weekly Open: $3,604 | Weekly High: $3,604 | Weekly Low: $3,466 | Last: $3,535
Cash – 3’s: $2c
Stock: 319,925mt (-13,275mt) | Cancelled Tons: 69,400mt (-9,175mt)
Weekly Open: $13,615.50 | Weekly High: $13,698 | Weekly Low: $13,482.50 | Last: $13,698
Cash – 3’s: $52.5c
Stock: 364,100mt (-15,125mt) | Cancelled Tons: 140,325mt (+1,150mt)
Weekly Open: $3,537 | Weekly High: $3,584 | Weekly Low: $3,491 | Last: $3,584
Cash – 3’s: $6c
Stock: 107,750mt (-3,200mt) | Cancelled Tons: 15,850mt (-2,450mt)
Weekly Open: $1,990 | Weekly High: $1,990 | Weekly Low: $1,944.5 | Last: $1,966
Cash – 3’s: $1c
Stock: 305,875mt (-4,475mt) | Cancelled Tons: 21,825mt (-1,325mt)
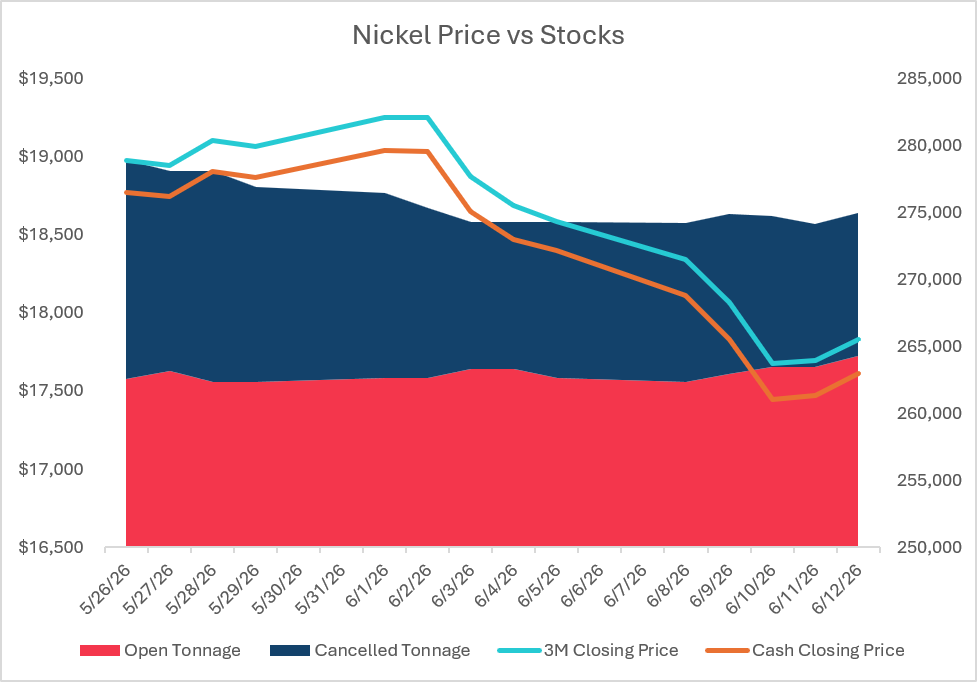
Weekly Open: $18,341 | Weekly High: $18,341 | Weekly Low: $17,678 | Last: $17,830
Cash – 3’s: $216c
Stock: 274,938mt (+702mt) | Cancelled Tons: 10,692mt (-888mt)
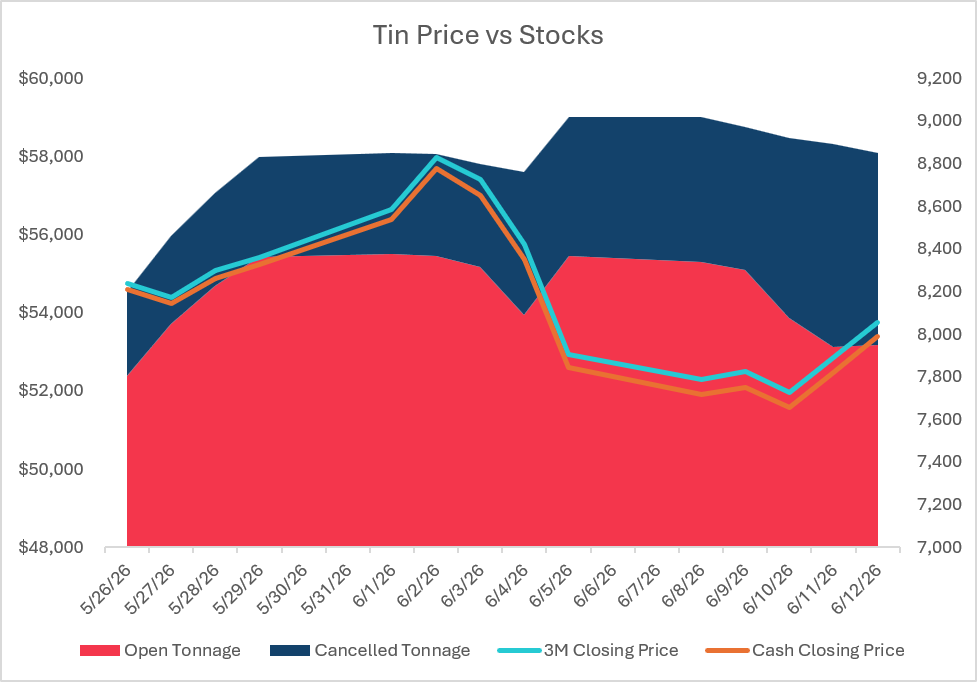
Weekly Open: $52,279 | Weekly High: $53,752 | Weekly Low: $51,960 | Last: $53,752
Cash – 3’s: $366c
Stock: 8,850mt (-170mt) | Cancelled Tons: 900mt (+245mt)
Copper is one of the cleanest examples of a metal where the physical, macroeconomic, and strategic narratives overlap. It is exchange-traded, financially liquid, globally consumed, physically difficult to replace in many applications, and highly exposed to long-cycle themes such as grid expansion, electrification, industrial automation, defence, and data-center growth. This is why copper often receives more attention than other base metals when the market is trying to understand the direction of the broader industrial complex.
| Demand area | Where copper is used |
|---|---|
| Building & construction | Wiring, plumbing tube, heating/cooling systems, roofing, fire sprinklers, fittings, and electrical distribution. |
| Power grids & electrification | Transmission and distribution cables, transformers, substations, busbars, grid interconnections, and renewable power connections. |
| Transport | Traditional vehicles, EVs, charging networks, rail, ships, aircraft systems, motors, inverters, and wiring harnesses. |
| Electronics & machinery | Connectors, printed circuit boards, semiconductors, motors, industrial equipment, automation, robotics, and heat management. |
| Data centers & AI | Power delivery, cabling, cooling systems, backup power, transformers, switchgear, and grid upgrades around large facilities. |
Producers and Consumers
Copper mine supply remains geographically concentrated – Chile is still the largest copper mine producer, followed by the DRC, Peru, China, and the United States. On the demand side, China remains the dominant consumer and fabricator, accounting for well over half of global refined copper usage. That makes copper particularly sensitive to Chinese construction, manufacturing, grid investment, and inventory cycles.
Dr. Copper
Copper is sometimes called ‘Doctor Copper’ because it is viewed as a diagnosis tool for the wider economy. Because of copper’s broad exposure to the real economy, when construction, manufacturing, infrastructure investment, and consumer durables are expanding, demand for copper usually increases. When those sectors slow down, copper demand also softens. It is not a perfect economic forecast tool – speculative positioning, exchange inventories, arbitrage flows, currency moves, and supply disruptions can all influence short-term price action. But copper remains one of the most watched industrial indicators.
Supply Deficit
The copper bull case is not simply that demand is growing exponentially. It is that demand is growing at a time when supply growth is slow, ore grades are declining, capital intensity is high, permitting is difficult, and many large mines are in geographical regions with higher political, water, energy, and labour risks.
The bearish counterpoint is that high prices can slow demand, encourage substitution where possible, increase scrap supply, and incentivize new supply. This is why market balance forecasts can shift quickly from deficit to surplus depending on assumptions for China, mine disruption, secondary production, and project ramp-ups.
Copper’s flat price can move sharply on macro events, but the longer-term structural copper story will be decided by whether mine, scrap, smelting, and logistics capacity can keep pace wit the electrification and power-demand cycle.

Copper concentrate deliveries from Mongolia's Oyu Tolgoi mine returned to normal after protesters briefly blocked a key export route to China.

The Iran ceasefire is being read as good news for Gulf aluminium producers. The spread data tells a different story.

Protesters blocked a transport route serving Rio Tinto's Oyu Tolgoi mine in Mongolia, disrupting copper concentrate exports and prompting warnings of economic losses.

Argentina has approved the Vicuna copper project - a joint venture between Australia's BHP and Canada's Lundin Mining - in what Economy Minister Luis Caputo called the largest mining project in Argentina's history.
Stay connected with our latest developments. Share your details to receive updates and analyses from LME Insight.